
What 207,830 search impressions actually tell a business owner
A real GPS tracking business, 1,119 search clicks and a useful lesson: visibility, visits and sales answer different questions.
On this page
A chart rising from almost nothing is encouraging. Deciding what it proves takes more care. Fleetalyse, a GPS tracking hardware and fleet software business, gives us a real example to examine.
Relationship disclosure: Fleetalyse is part of founder Vytautas Pipiras's project portfolio. The SEO Blog and sister agency SuffolkWeb are operated by Fleeta Limited. This is an analysis of our own project evidence, not an independent endorsement or a controlled experiment.
The report and its limits
Fleetalyse's Google Search Console Web report for 19 March–18 September 2026, without a country or query filter, records 1,119 clicks, 207,830 impressions, 0.5% average CTR and 18.3 average position. The exact totals were checked in the connected account on 20 September; the screenshot displays rounded values.
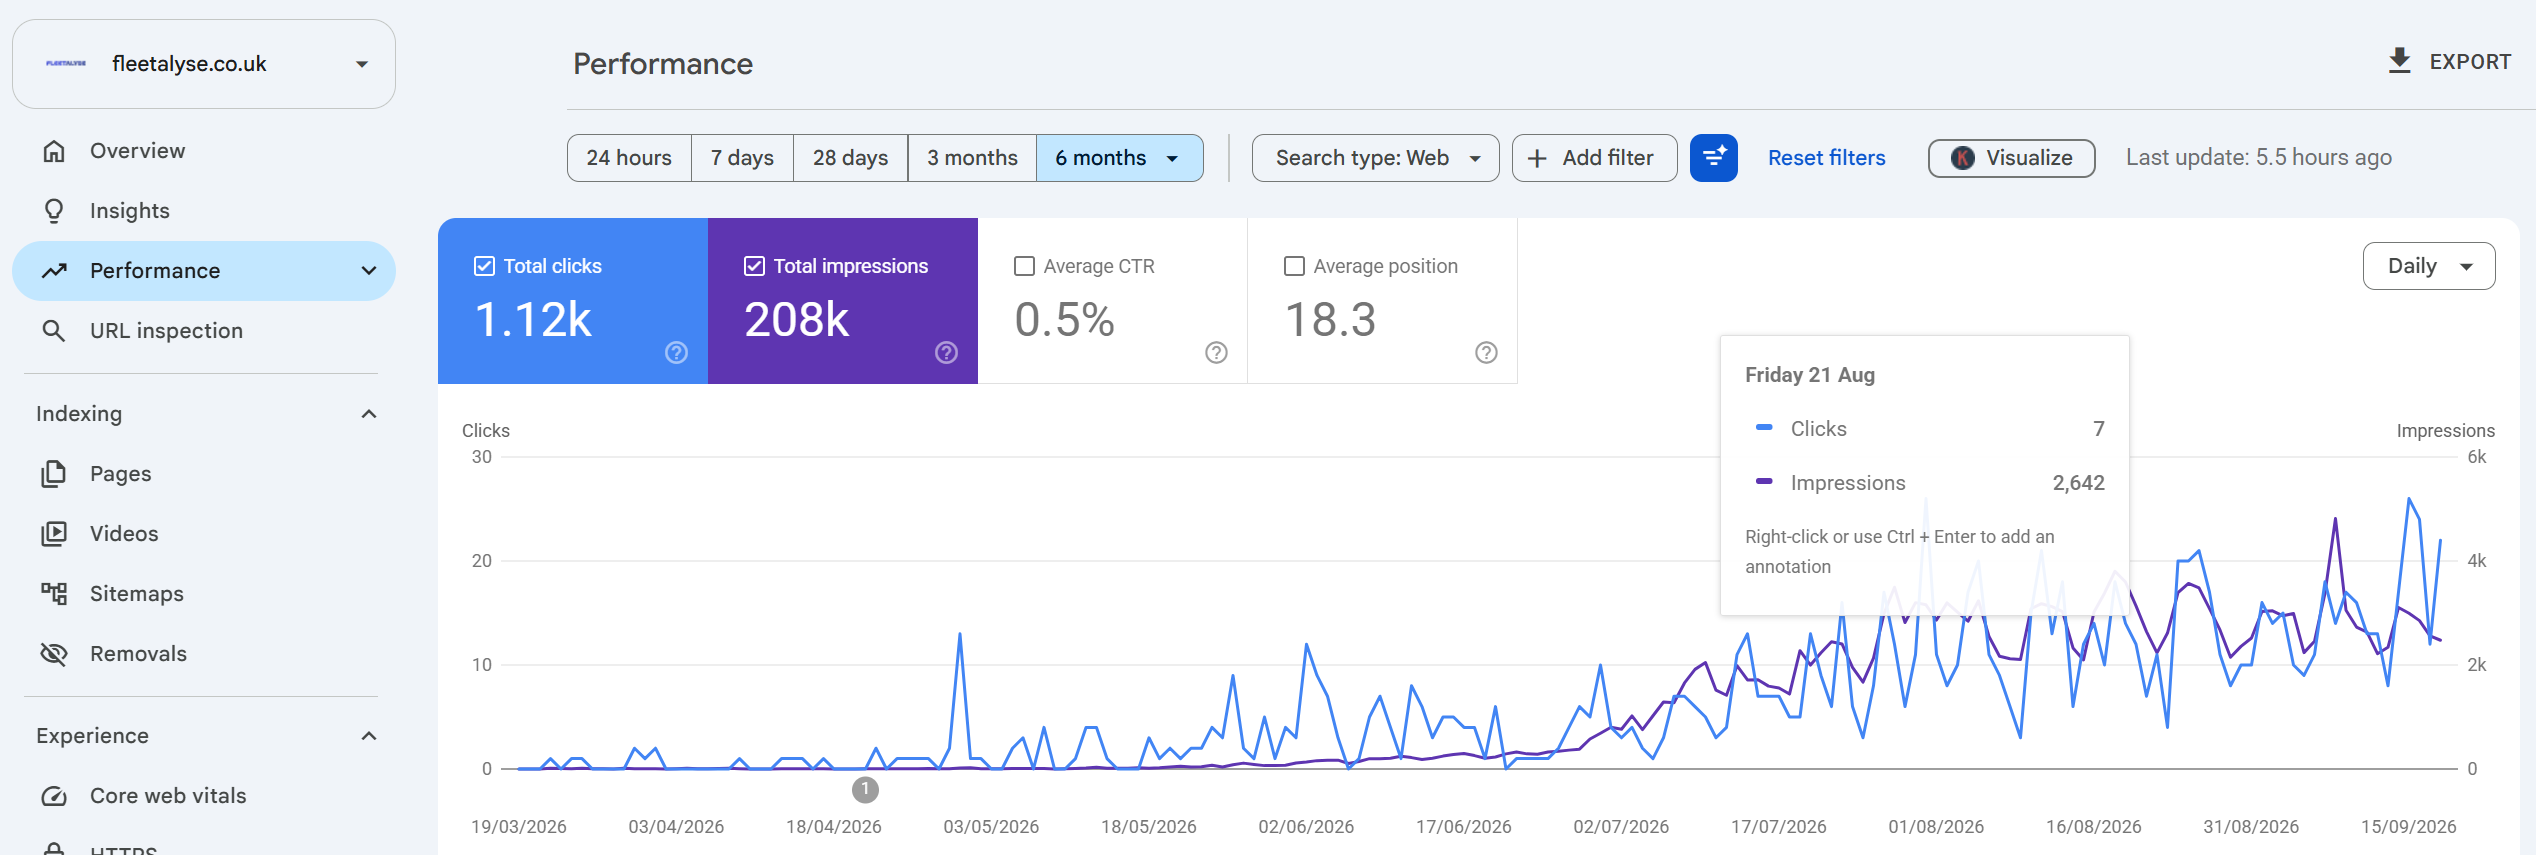
These are search measurements. An impression is an appearance under Google's reporting rules, not a unique person. A click is a visit from a search result, not an order. CTR divides clicks by impressions; the displayed percentage is rounded. Average position combines many appearances and does not mean every page sits at position 18.3. See Google's metric definitions.
Vytautas reports that Fleetalyse reached daily sales within six months. That is a separate business milestone. No order export or organic-sales attribution is presented here, so the chart does not prove that all those sales came from Google or that one SEO tactic caused them.
Split the query list before drawing conclusions
The brand query “fleetalyse” recorded 161 clicks and 275 impressions. Among non-brand terms, “teltonika fmc003” recorded 10 clicks and 191 impressions, while “renew digital tachograph card online” recorded 7 clicks and 655 impressions.
Those searches express different needs: finding a known company, researching a specific product and solving an operational question. A single total hides that distinction. A product query deserves a clear product page; an administrative question needs an accurate explanation and a relevant next step.
Broader phrases show another stage of the work:
| Query | Impressions | Clicks |
|---|---|---|
| commercial vehicle tracking | 1,496 | 0 |
| hgv tracking | 1,340 | 1 |
| fleet tracking uk | 1,015 | 0 |
These rows demonstrate exposure with few visits. They identify questions worth investigating, not completed commercial wins. The rows are examples from the same report, not a complete dataset; reported queries need not add up to the property's total.
Three useful decisions from this evidence
Keep brand and non-brand learning separate. Someone who already knows the name is different from someone choosing a tracker. Report both, then review the pages and next steps serving each group.
Investigate high-impression, low-click pages. Check the actual landing page, query relevance, positions and search presentation before rewriting titles. Zero clicks alone does not tell us whether the cause is the result's position, competition, intent or another factor.
Connect attention with an appropriate action. Product researchers need specifications and purchase information. Guide readers may need a related explanation. Measure subsequent orders or enquiries through the systems that handle them, with an attribution method you can explain.
These are proposed next steps from the data, not claims that each action has already produced an uplift.
Why the Ahrefs number looks different
SuffolkWeb's full Fleetalyse case study also contains dated Ahrefs keyword and AI-citation snapshots. Third-party estimated monthly traffic and six months of Search Console clicks are different measurements. Do not add them together or describe Ahrefs keyword search volume as impressions earned by your own site.
Apply the same discipline to your site
Choose one useful page. Save the reporting period and filters, separate brand and non-brand questions, and record the business outcome separately. Make one explainable improvement and log its date. Compare an equivalent period while noting other changes that may have affected demand.
Use our start-here baseline and content and measurement reading path. The full project story and implementation services are on SuffolkWeb. Another business may have a different market, starting point and result.
For your own site, use the search baseline workbook and repeatable investigation method to preserve the starting evidence and record what changes.

